
Insights: charts of your sales
Pictures instead of tables: sales and profit by day, best-selling items, busiest days and hours.
Where to find it Open this screen in Quid POS
Go to .
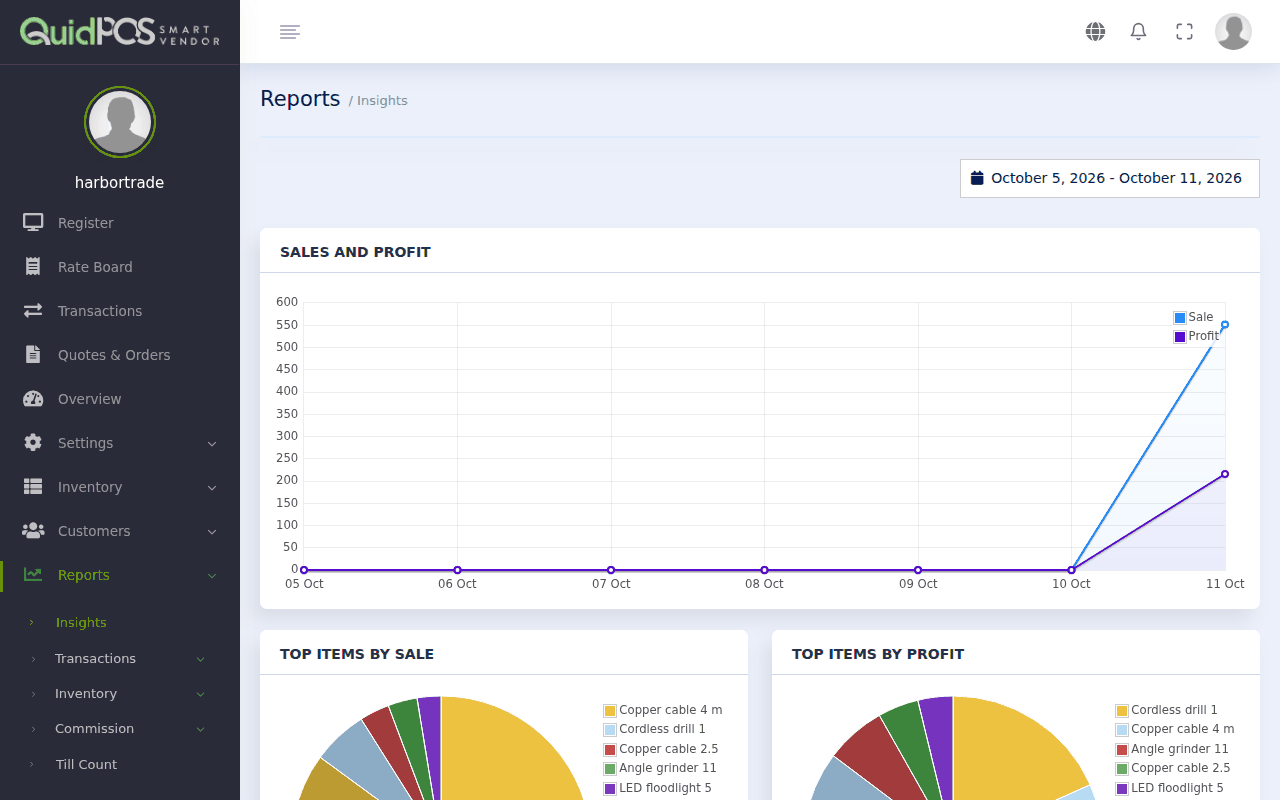
Top half: a chosen period
Pick the dates at the top. You get:
- Sales and Profit: a line for each day, so you can see good and bad days at a glance.
- Top Items By Sale: the items that brought in the most money.
- Top Items By Profit: the items that earned you the most. This list is often different from the first one, and it is the more important of the two.
Bottom half: trends
This part has its own date range, usually a longer one.
- Sales By Day of Week: which weekdays are strongest.
- Sales By Time of Day: a grid of days and hours. Darker squares are busier.
Use the trends to plan staffing and opening hours: put more people on at the busy times, and do stock counts and deliveries in the quiet ones.
NextStock report: what you have and what it is worth →Did this answer your question? If not, email us and tell us what you were trying to do. We read every message.